gDiagramm v 0.0.5 |
| [ Top ] [Russian] |
|
What is it?
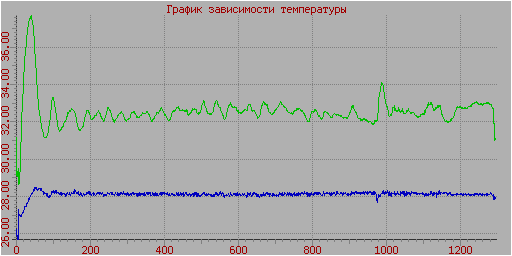
| Picture on right was made in tenth of second from command line:
gDiagramm.exe TempTest.dat TempTest.form |
|
| Sample of data file (logfile of temperature measurement TempTest.dat)
Graph present columns 2 and 3 (first column is zero, as in C-notation) |
60, 0.000, 28.62,27.30, 28.25,27.00, 28.75,28.00, 0.133,0.183, 0,0,Tue
Jul 3 18:39:02 2001
120, 0.980, 28.62,27.13, 28.25,26.25, 29.50,27.50, 0.206,0.272, 0,0,Tue Jul 3 18:40:02 2001 180, 0.980, 28.77,27.03, 28.50,26.50, 29.50,28.00, 0.160,0.263, 0,0,Tue Jul 3 18:41:02 2001 240, 0.980, 29.12,26.98, 28.00,26.25, 29.75,27.50, 0.235,0.228, 0,0,Tue Jul 3 18:42:02 2001 300, 0.980, 29.54,26.96, 29.25,26.25, 30.50,28.00, 0.215,0.251, 0,0,Tue Jul 3 18:43:02 2001 360, 0.980, 30.07,26.92, 29.75,25.50, 30.50,27.25, 0.187,0.268, 0,0,Tue Jul 3 18:44:02 2001 [....] |
| File with description of data format (TempTest.form) | ;format string
form.Format=%i,%lf,%lf,%lf,%lf,%lf,%lf,%lf,%lf,%lf,%i,%i,%s %s %s %i:%i:%i %i form.DimX=512 form.DimY=256 form.FileOut=demo.png form.Title=Graph of temperature form.BackColor=0xb0b0b0 form.FormatX=%.f form.FormatY=%.2f field2.use=1
field3.use=1
|
| Second example:
voltage in Volts vs time in seconds |
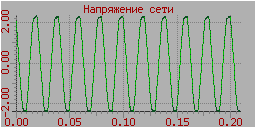
u220.png |
| 2D data |
 |
What's inside?
gDdll.dll made from
gDiagramm v0.05
History:
v0.05 25.06.2005
v0.03 12.01.2002
gDiagramm v0.03 (exe+samples)
gDiagramm v0.03 (src)